Introduction to technical analysis: Basic principles, Dow Theory, Price chart
Technical analysis is the study of the past price to predict the price in the future. Meanwhile, various tools are used: indicators, graphical figures, etc. Technical analysis does not search for the reason for price changes, but predicts the most possible change based on information for the previous period.
Technical analysis is used by both investors and traders. An investor can rely only on fundamental analysis, about which we wrote earlier, but at the same time use technical analysis in order to acquire an asset at the most favorable price.
Basic principles of technical analysis
- The price takes into account everything. All factors influencing the price have already been taken into account by the market and are reflected in the price. This fact means that from the chart of the price and trading volume, you can get all the information necessary for making a trading decision.
- Price movement is dependent on trends. The market is prone to the formation of certain trends that have a certain duration. The trend can be either growing or falling. The rise or fall depends on the balance of supply and demand. Situations opposite to the trend may also arise. They are called corrections.
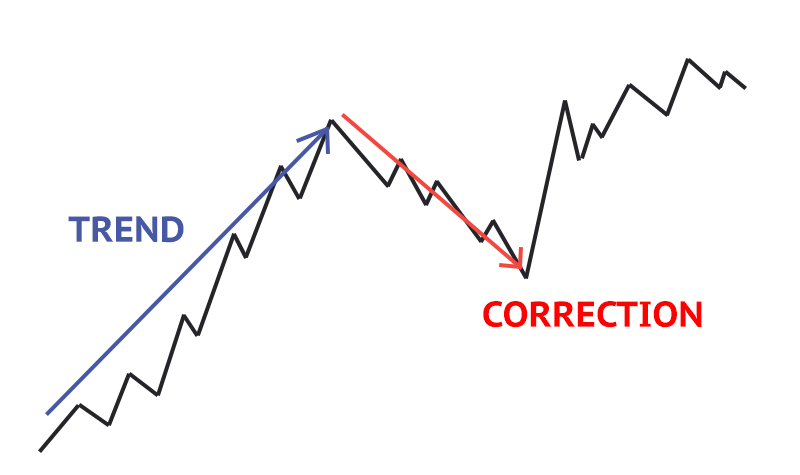
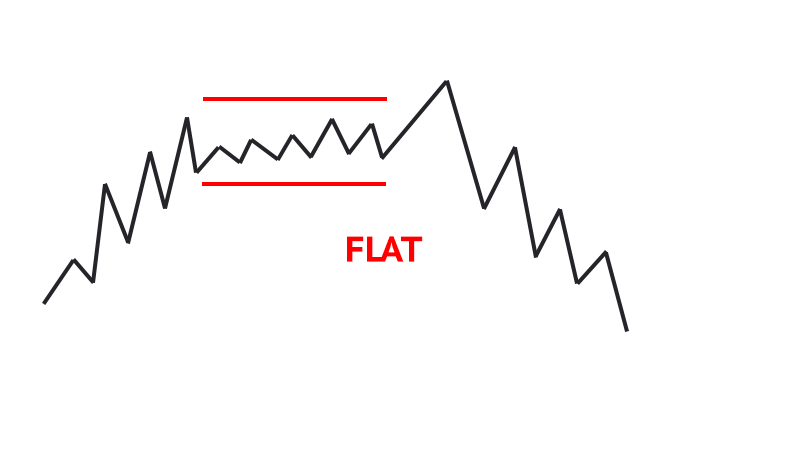
Also a flat situation when there is no trend can arise in the market. It looks like a horizontal price movement.
3. History tends to repeat.
The price in the past has been subject to certain changes in certain situations, which means that in the future, in similar situations, the price (the ratio of supply and demand, that is, the behavior of people in the market) is likely to react in a similar way.
The price chart is the best indicator of how the market is performing. It is a time-varying line, each point of which reflects information about the price and time of a transaction. Data on prices and trading volume are displayed on the chart based on the selected time interval – timeframe. For example, if the hourly timeframe is selected, the step on the horizontal axis will be equal to one hour.
The graph displays 5 main indicators corresponding to a certain period of time:
- opening price is the price at which trading starts
- closing price is the price of the last deal
- maximum price is the highest transaction price for a certain period of time
- minimum price is the lowest transaction price for a certain period of time
- trading volume is the number of transactions for a certain period of time
The most important of these indicators is the closing price, as it reflects the bottom line between buyers and sellers.
Dow Theory:
Technical analysis has its origins in a series of articles by Charles Doe, founder of The Wall Street Journal, published in the late 19th century. This theory is considered as an attempt to describe the actions of a person and his psychology through charts and mathematical indicators. Let’s look at the basic principles of Dow Theory.
- Trends, depending on their duration, can be divided into three types:
– primary (long-term, valid for a year or more);
– secondary (medium-term or secondary, fixing movements against the movement of the main market trend);
– small (short-term).
Moreover, all three types of trends can be both growing and falling. According to Dow Theory, in an uptrend, the position of each subsequent peak or decline must be higher than the previous one. In a situation with downtrends, everything should be exactly the opposite.
- The long-term trend is characterized by three phases:
The first is the Accumulation Phase.
Experienced investors buy or sell stocks during this phase, despite the general market behavior (this phase is preceded by an opposite trend). This stage does not last long and is not accompanied by strong price changes.
The second is the Participation Phase.
At the beginning of this phase the so-called active traders with the help of technical analysis catch the beginning of the trend, which was begun by investors with large capital. When making deals, active traders strengthen the trend, which is accompanied by a strong price change.
The third is the Implementation Phase.
At the last stage, all market participants are aware of the current trend. Thus, at the beginning of this phase, some traders open positions in the direction of the trend. When traders assume the end of the trend, they close their positions at a profit.
- The trend must be confirmed by the trading volume.
Trading volume is a required indicator of the existence of a trend. If the price changes along with a small trading volume, then the trend is absent since it does not reflect the opinion of the majority.
- The trend is valid until there is a clear signal of its reversal (closure).
The market itself shows the moment of reversal or closure. This must be checked.
The main function of technical analysis according to Charles Doe is to select the safest and most optimal moments in order to open a deal and make money on speculation on the stock exchange in the long term.
Thus, in this article we got acquainted with the concept of technical analysis and made the main conclusions for ourselves:
- The market is the reaction of its participants, that is it is like an alive mechanism.
- On the charts we see the market balance of supply and demand.
- Technical analysis predicts the most likely change, however in order to succeed, you need to use the entire arsenal of tools.
An example of the use of technical analysis and, on its basis, the implementation of artificial intelligence is MonInvAI, which predicts the values of stocks and cryptocurrencies for the future period.