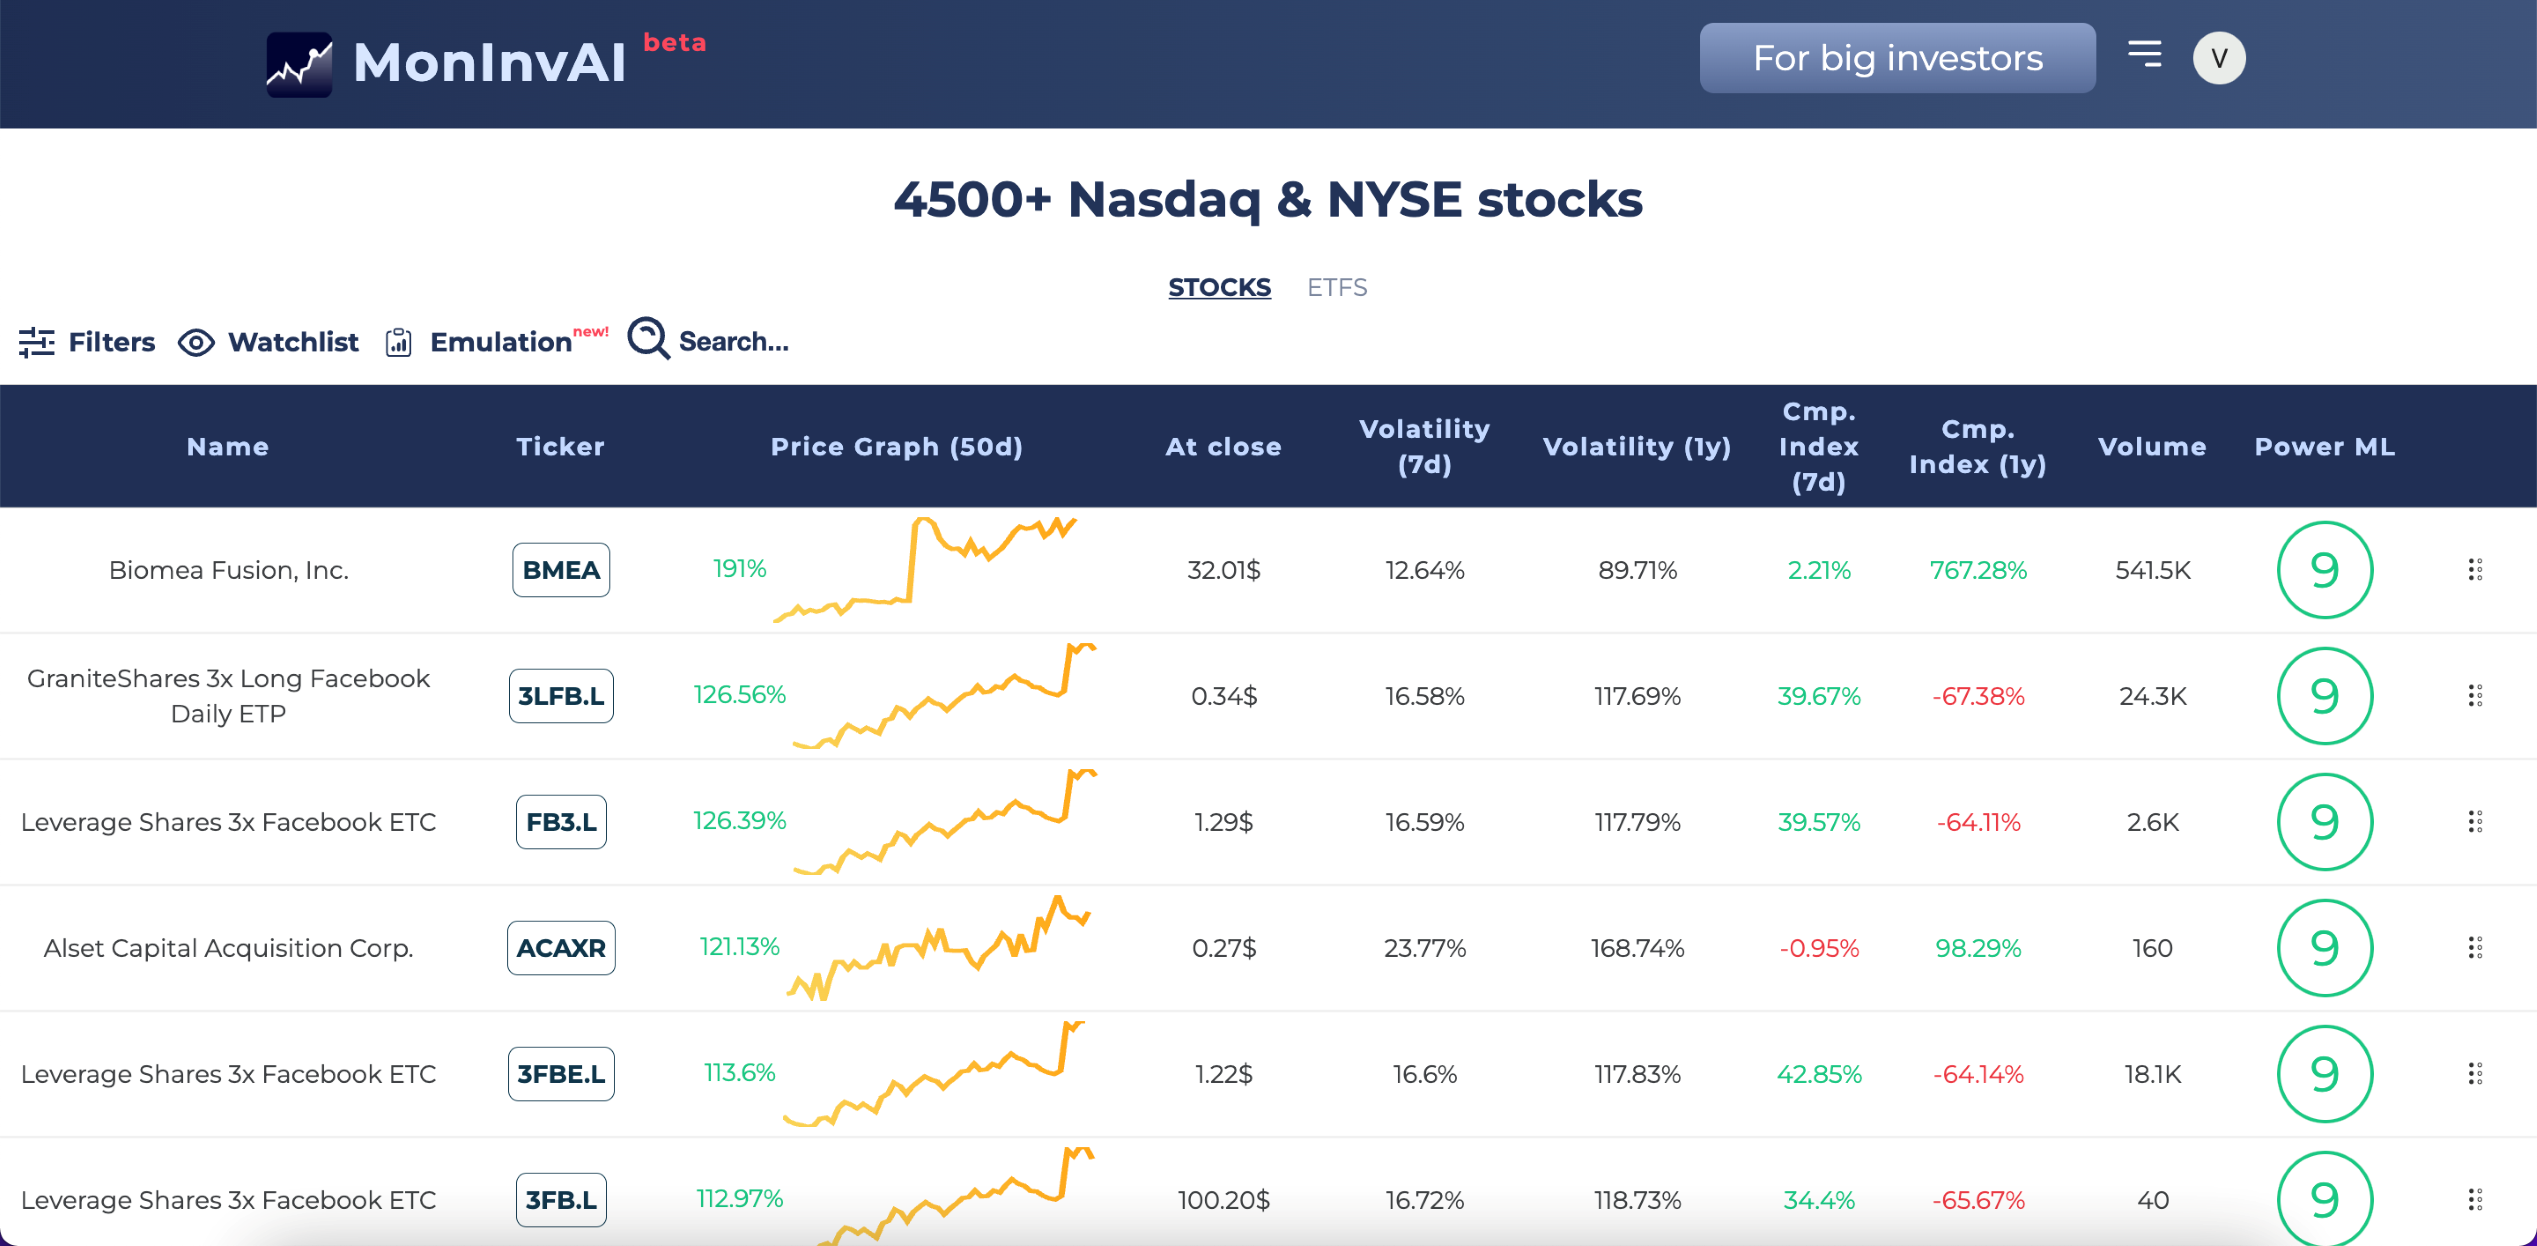
How can MonInvAI help you choose stocks and ETFs to invest in?
Stocks and ETFs are presented in two tables. A full list of available market options can be opened by clicking on one of them.
1. Select some attractive stocks or ETFs to consider for investing. In order to do it you can review the
full list of stocks or ETFs to see how charts behave in general and what our AI models suggest. Stock
filters, chart patterns, MonInvAI's recommendations for buying or selling could be also used.
For example, stocks with high Power AI (2-10), low volatility (below 3%), sufficient volume (more than 75K),
cmp. index above -3 and a good stable chart trend over the past 50 days (growth in the range of 0-25%) can
be a good option to buy.
2. Furthermore, each selected one can be examined more closely on the detailed page. You can also switch
from MonInvAI to Yahoo Finance and learn more there. Does the stock have positive fundamentals? Revenue
grows, profit grows, nice PE ratio (for stocks), high analysts expectations and etc.
And finally, having several pre-selected stocks, you could go to your broker application to open positions.
Don’t forget to follow a reasonable money-management strategy:
- Do not put more than 0.5-1% of your capital in each position.
- Limit your potential losses. Use stop-loss orders or buy call-options instead of buying stock itself.
- Keep a well balanced portfolio of stocks. It means having different stocks or ETFs in your portfolio from varied industries.
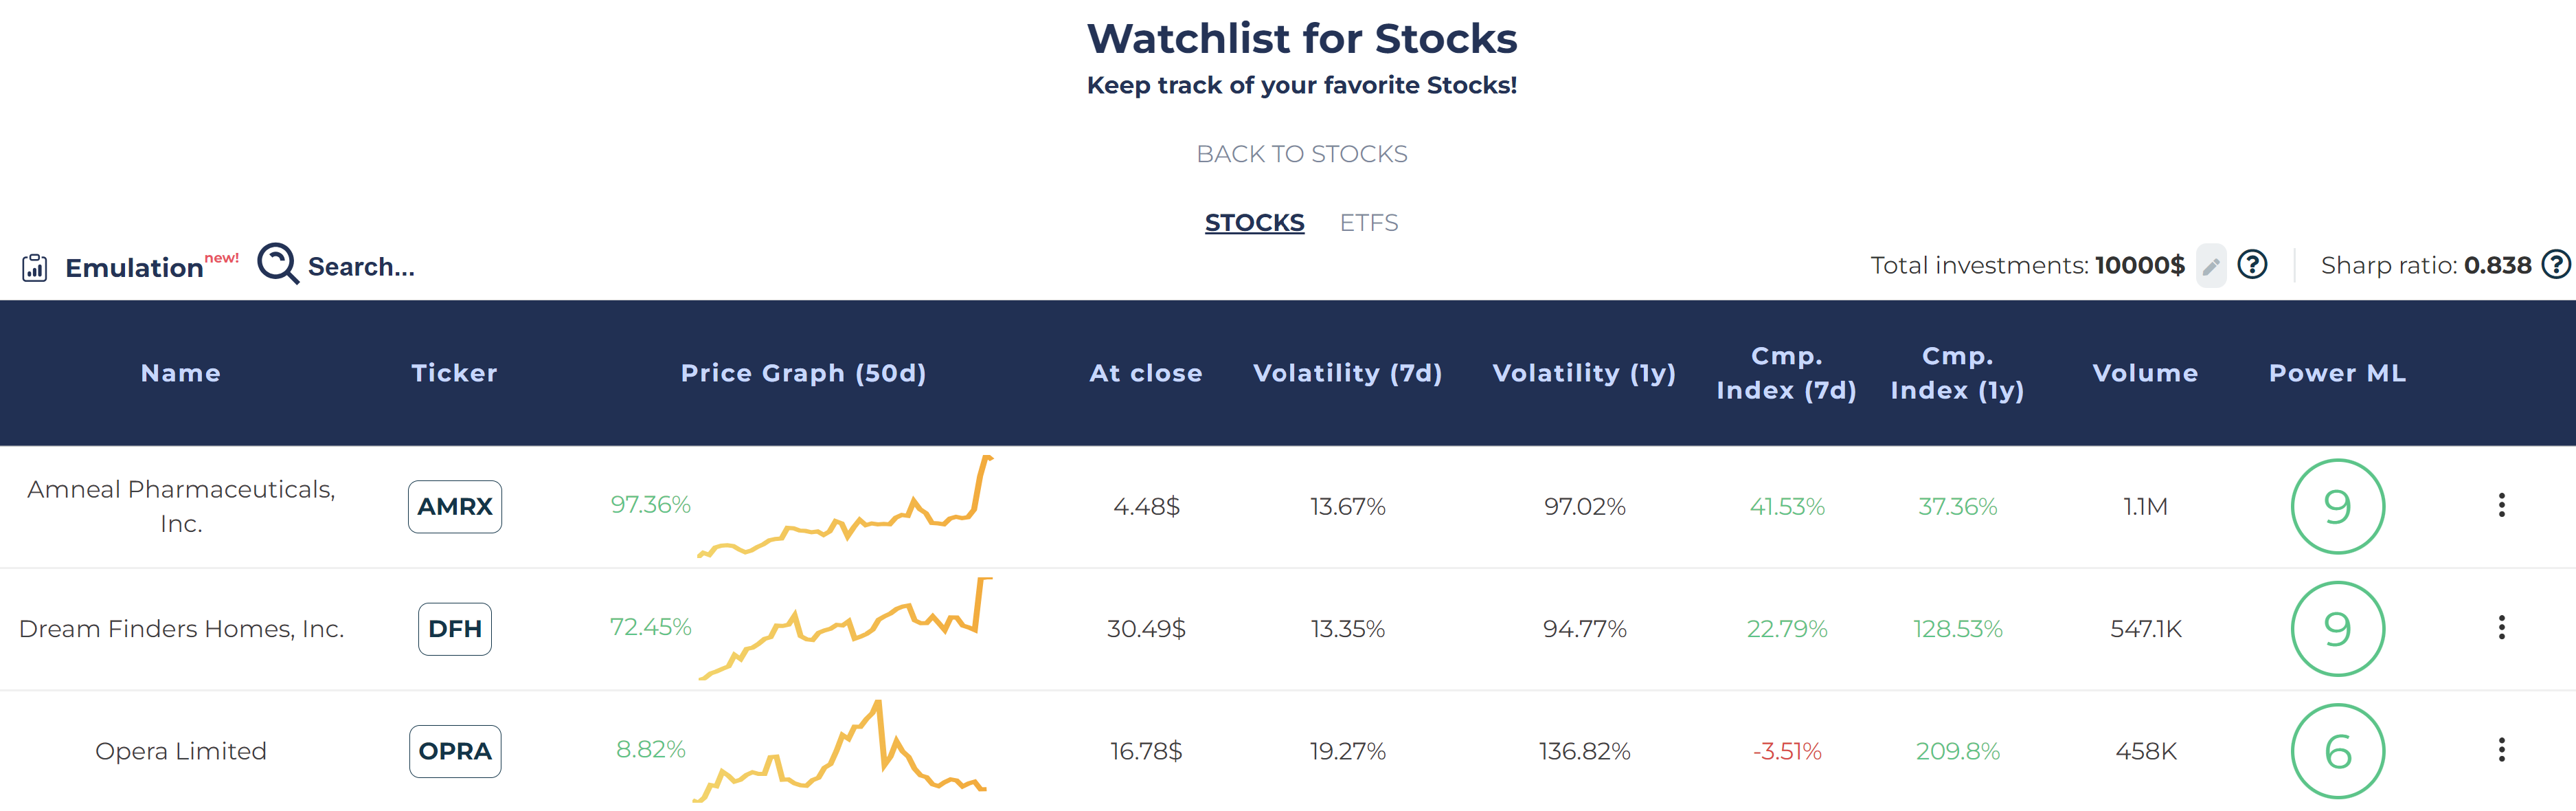
What do the main columns mean?
Name
It means the full name of the stock or ETF.
Ticker
It represents a unique short code for a stock or ETF and serves as an identifier within an exchange
platform.
Price graph
The graph of stock’s or ETF’s growth with the percent sign that indicates the change of stocks or ETFs at
close price for the latest 50 days.
At close
It shows the last price of the stock before the market officially closes.
Volatility (7 days)
It shows how the stock’s or ETF’s at close price changes over 7 days.
Volatility (1 year)
It shows how the stock’s or ETF’s at close price changes over 1 year.
Cmp. Index (7 days)
The Index is calculated using a formula developed by MonInvAI and shows the average ratio of the NASDAQ or
NYSE Composite (index) for 7 days to the ratio of the stock's at close price for the same period.
Cmp. Index (1 year)
The index shows the difference between the percentage change in the price of an at close stock over a year
and the percentage change in the price of the at close index over the same period.
Volume
It shows the total volume of existing stocks or ETFs.
Power AI
Power AI is calculated using a self-developed formula, based on the probability of given algorithms
predictions and the expected changes. It includes both technical and fundamental analysis (for example,
P/S, P/E, EBITDA multipliers). The indicator provides an assessment of the attractiveness of investing in
this company on a scale of -10 to 10.
How does the main functionality work?
Filters
Click on the filters button to open them. Here you can filter by exchanges, market sectors and industries, price ranges, volatility, volume, Cmp. Index, at close price and power AI.
You can also use filters For buying and For selling with 20 of the most relevant stocks based on the current state of the market. And also filter by the availability of options and by chart patterns.
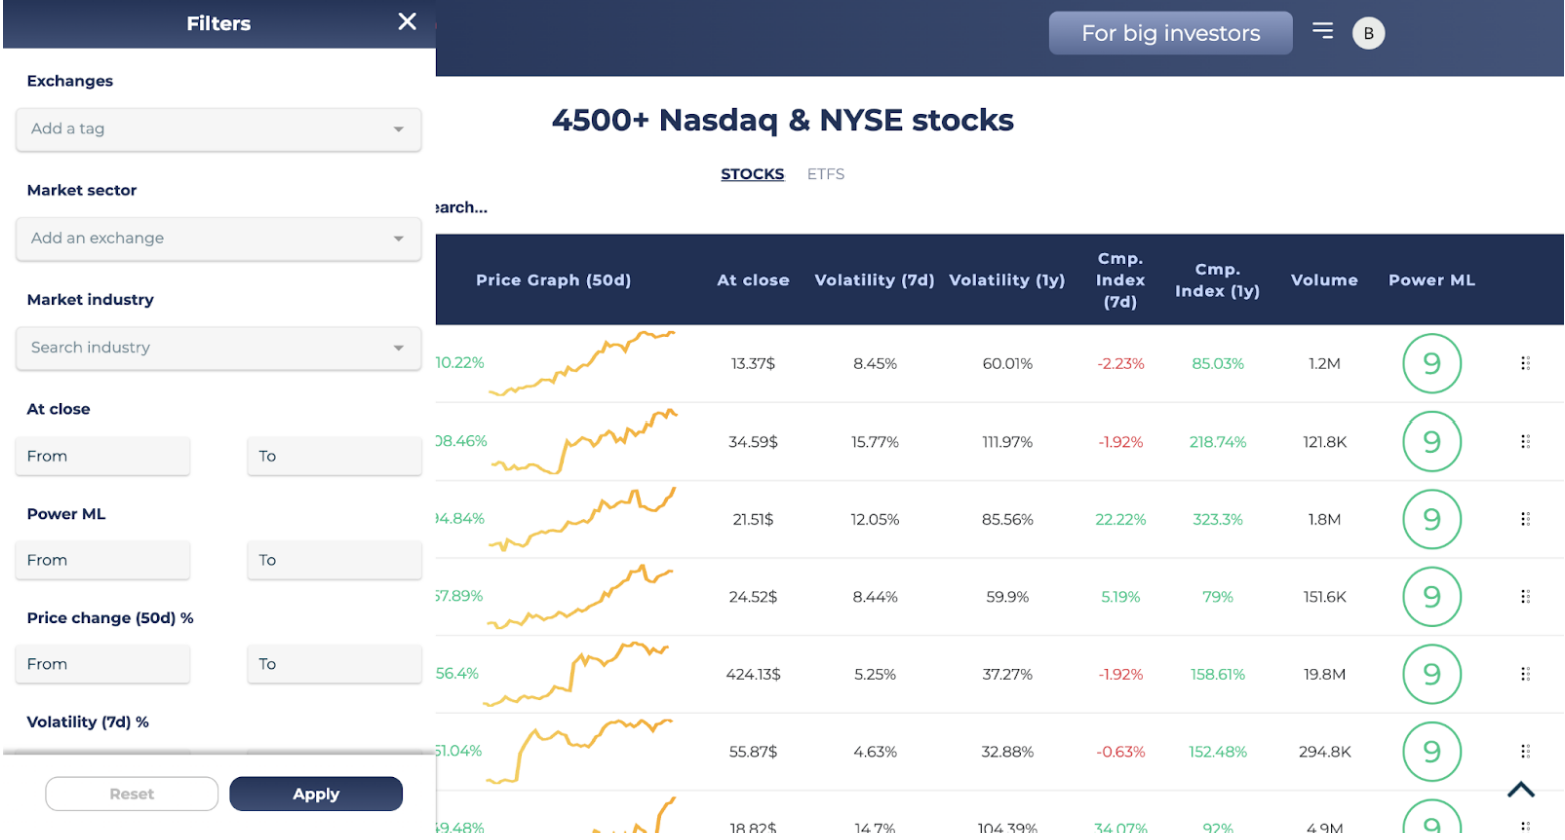
Chart patterns
Chart patterns are one of the most powerful tools that you can use in your trading. Remember: To apply filters, you can select only one pattern and you cannot select multiple chart patterns or use a selected chart pattern with a custom pattern at the same time.
To select your favorite pattern just click on it. To cancel your choice also click on it again. Also you can use a chart pattern with different values of the filter: Exchanges, Price Change (50d), Volatility (7d), Volume, Cmp. Index, At close, Power AI, Recommended values.
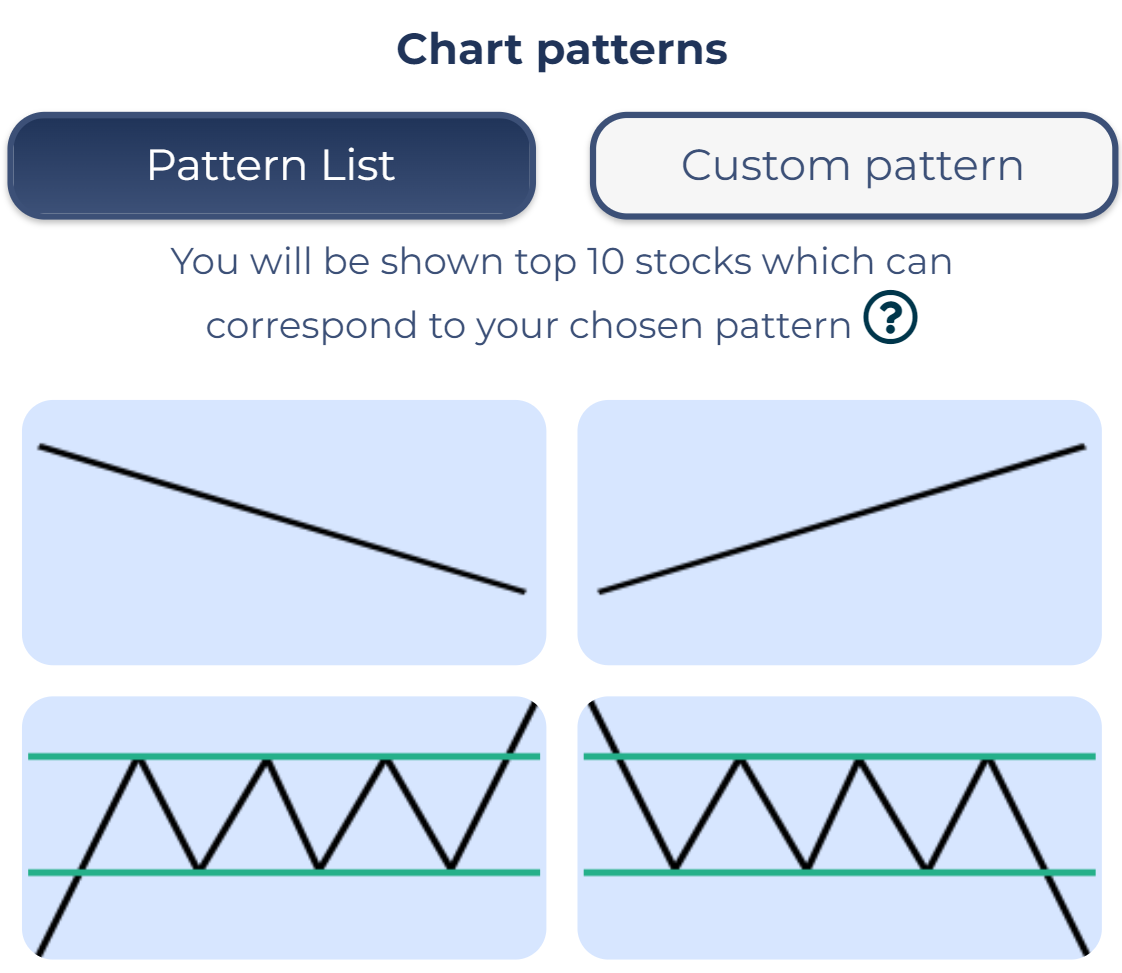
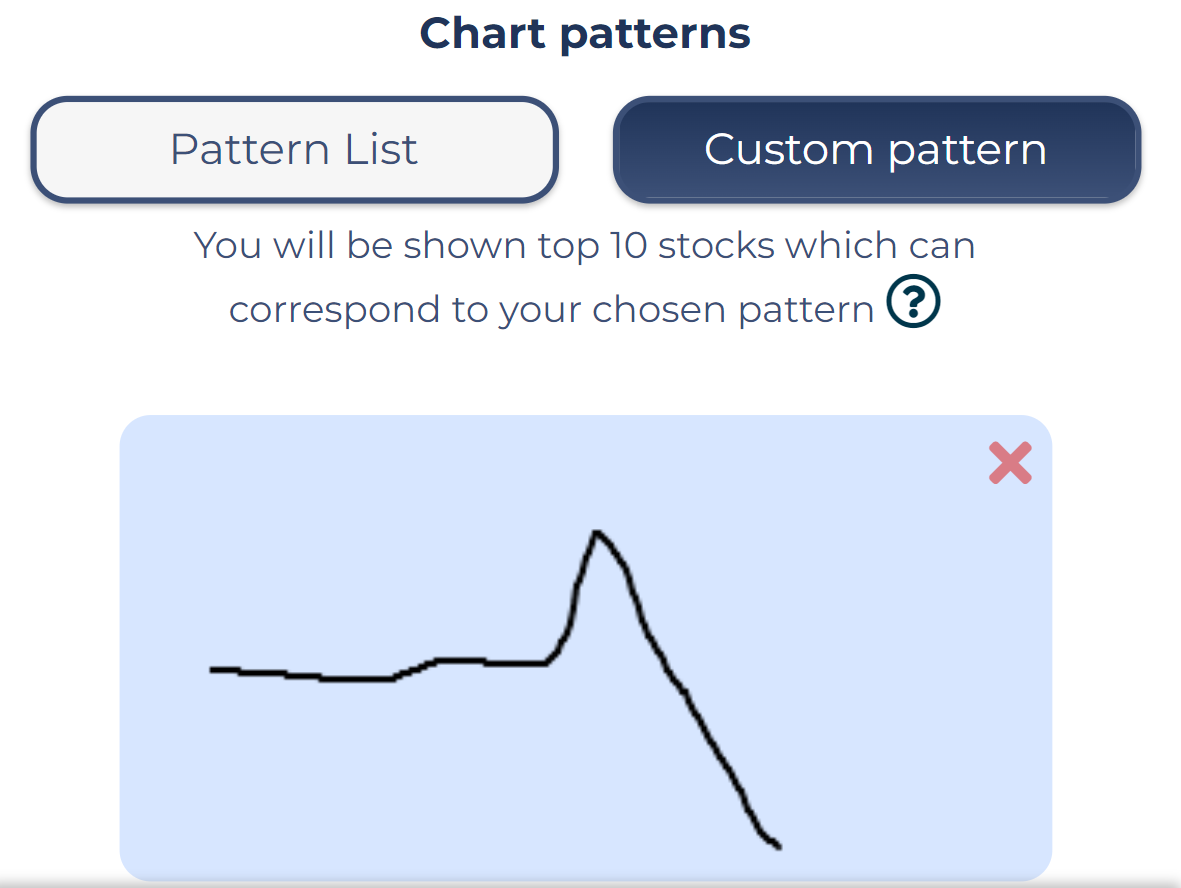
Custom pattern
Couldn't find an appropriate pattern? You can draw your own! Remember: to apply filters you can't use the custom pattern with the list of chart patterns at the same time.
Quick sorting
You can sort all options by each indicator. To do this, click on the desired indicator in the table header and the entire list will be sorted in ascending order. To change the sorting type, click again. The sorting type is displayed as the sorting arrow. If you want to filter stocks according to your wishes or find a specific one, then you need to register in order to open this feature.
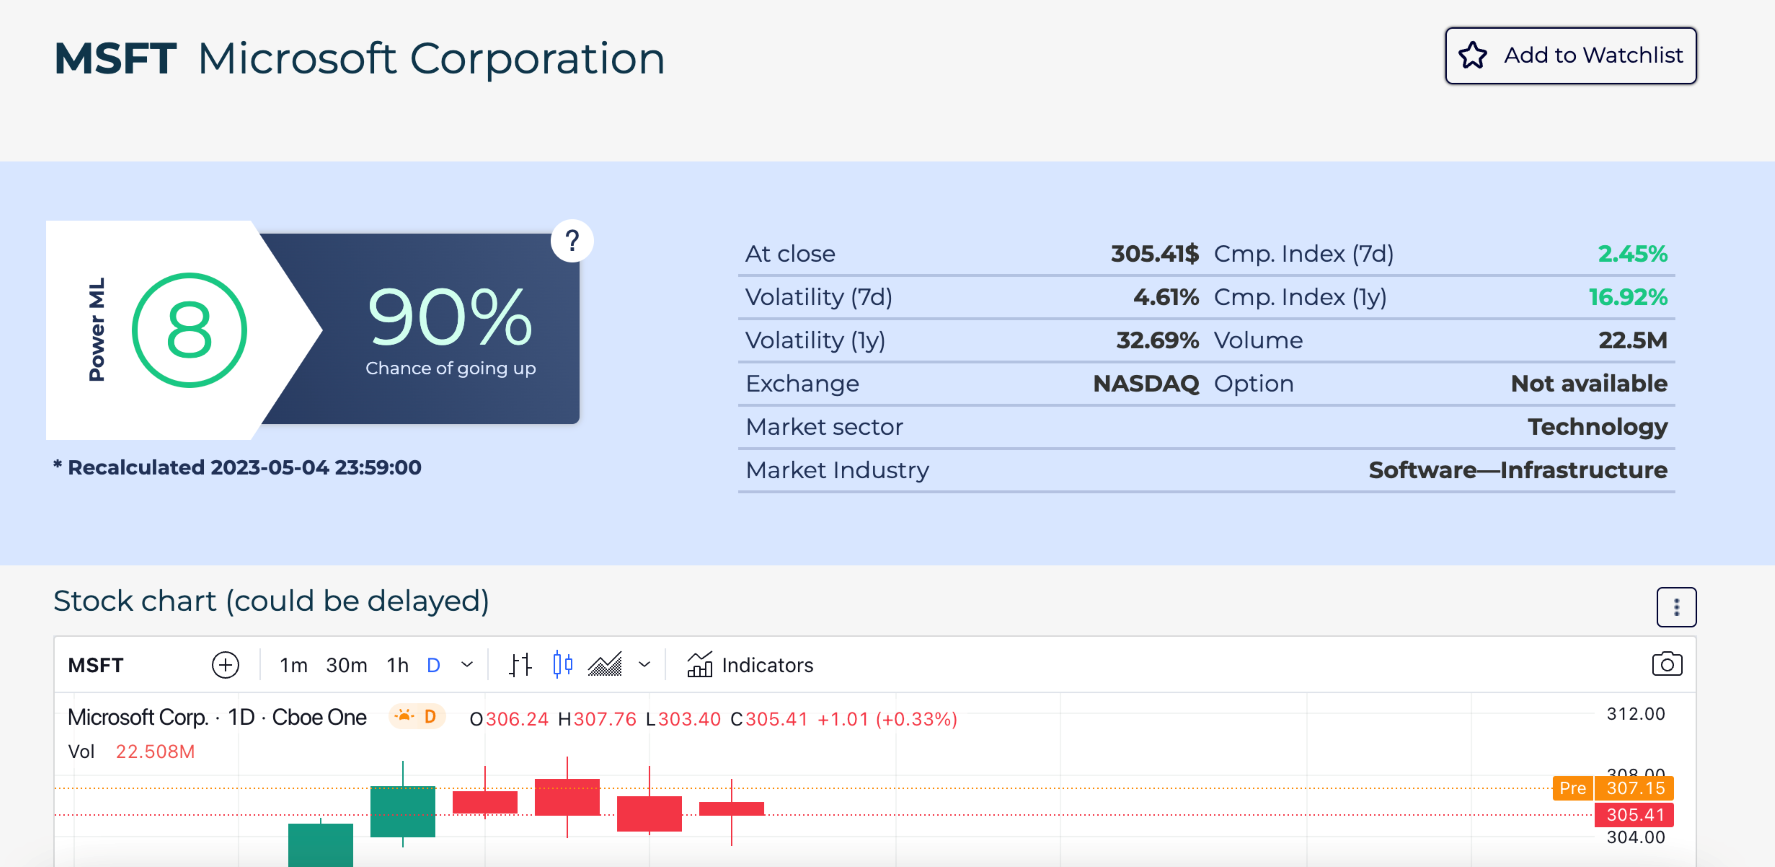
Detailed page
You can find out details about a stock or ETF by going to the detailed page. You need to click on the ticker of the one on the main page and go to the opened tab.
On the detailed page you will see basic information about the asset, power AI, chance of going up, a stock chart and the history of predictions.
Quick searching
You can easily find any asset you want by clicking on the search icon and entering the name or ticker.

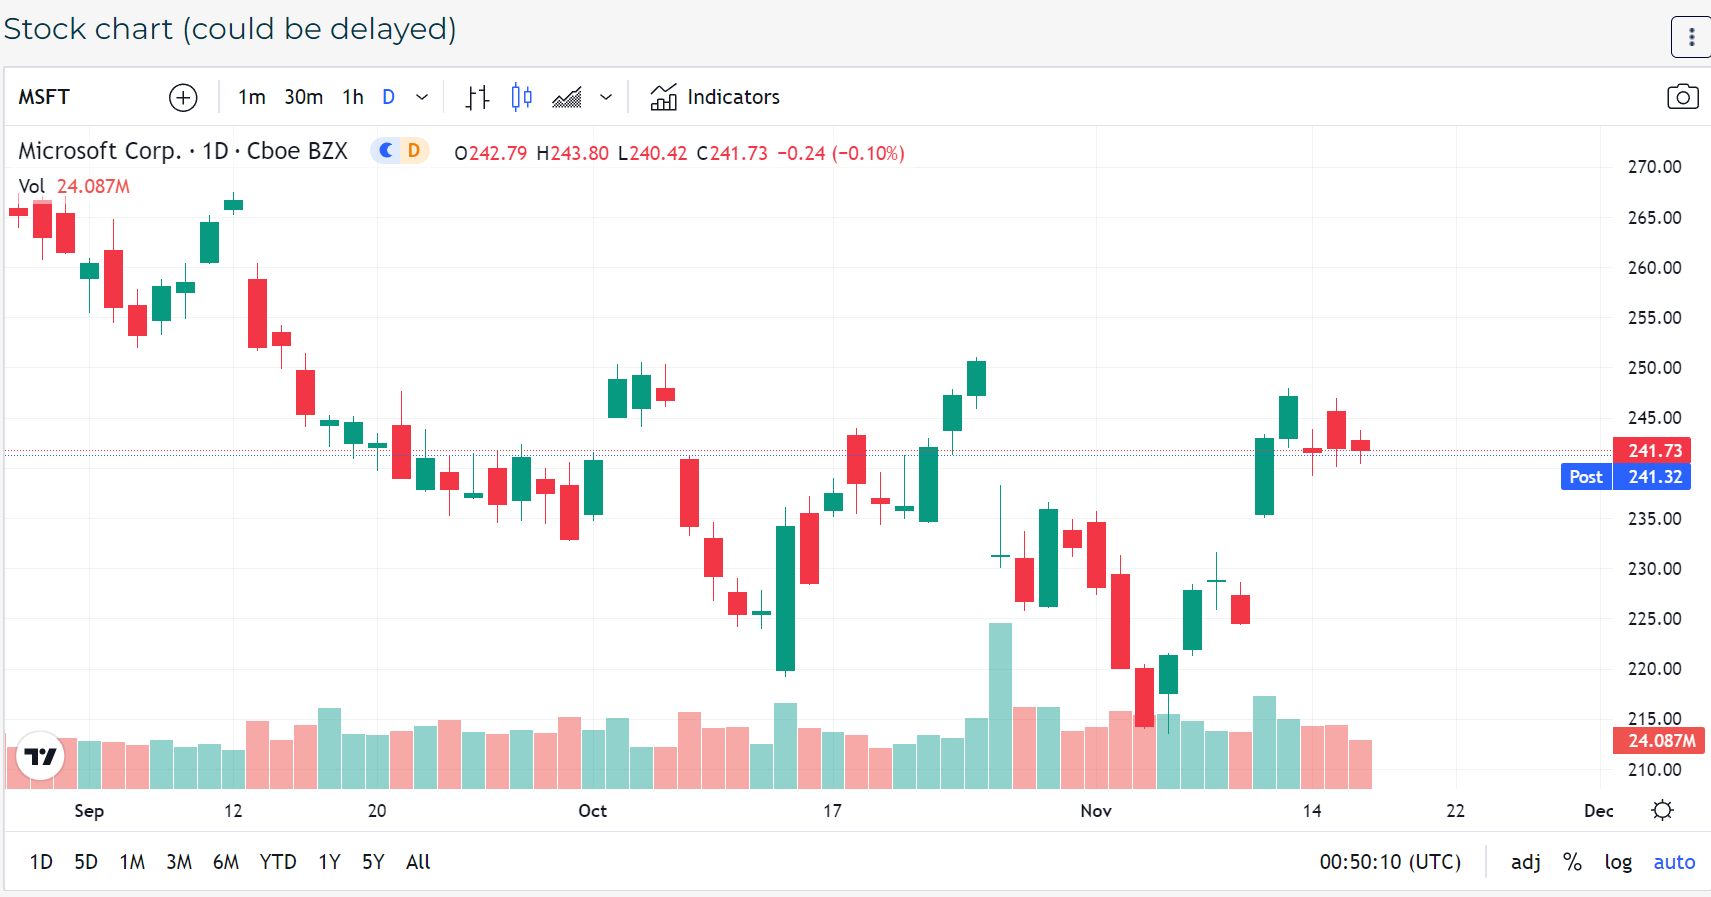
Stock chart
On the chart you can change the type of display, to increase or decrease the time interval according to your preference and convenience. Also you can change a type of display line. Please note that there may be a delay of 15 minutes in the display of the graph data.
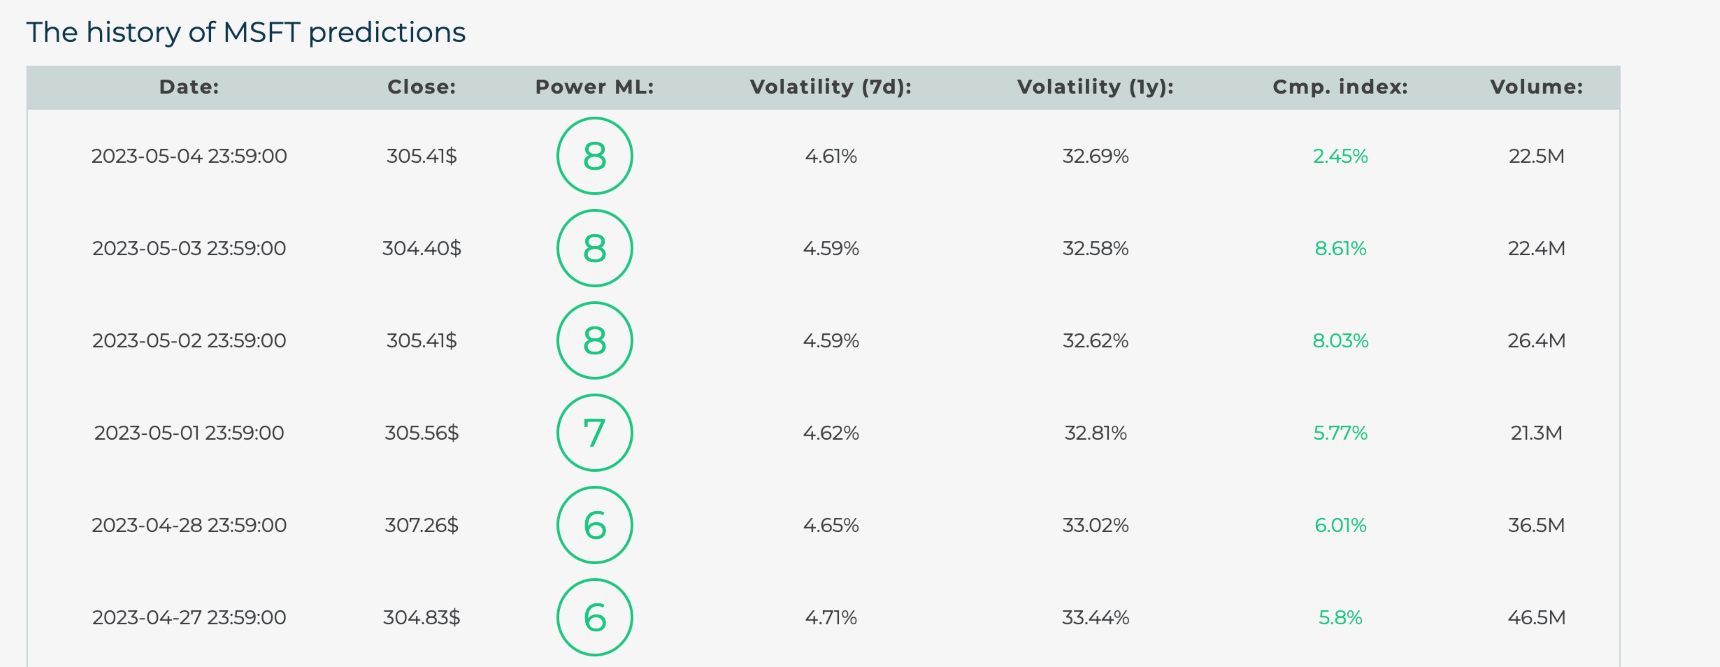
History of predictions
In this table you can see how the stock or ETF behaved in the previous days, its detailed changes and power AI.
Watchlist
After signing up you will immediately have the opportunity to save the stocks and ETFs you are interested in to your Watchlist, so that you can quickly find your assets and check their growth. After you have added all the stocks or ETFs you are interested in to the Watchlist, you can go to it from the main page.