Technical analysis: Types of trends and Japanese candlestick chart
In the first part of the article we studied the basic principles of technical analysis and began to get acquainted with the price chart. Now we will pay even more attention to charts and technical indicators.
A price chart is a stream of data on exchange transactions. It looks like a changing over time line. The points of the line are a reflection of information about the price and time of transactions.
The chart has a linear form and is tick according to the time interval of construction. This graph shows each price change. Tick chart is a chart that is formed not by time, but by deals. That is, when a deal is carried out, a tick is formed.
However, due to the huge amount of data, the tick chart is not easy to analyze. Therefore, in order to optimize graphical analysis, the data on the chart is displayed in accordance with the selected time interval or timeframe.
Types of trends
As you could already understand, the direction of the price is formed by the market participants. One of the tasks of technical analysis is to determine the trend of this direction.
An uptrend is characterized by a sequence of upward highs. This means that each local high (maximum) is higher than the previous one. The same situation is with the local lows (minima) of the growing trend – they are ascending.
The inability of the market to overcome the previous high indicates a weakening of the trend and is an early warning of its reversal. Any drop below the previous minimum signals a reversal and the beginning of a downward trend.
If the growing trend failed to become higher than the previous high, but there was no closing below the previous low, we can say that the market is entering a sideways movement.
Local highs and lows of the falling trend form a downward trend. The inability of the market to close below the previous low, and then a successful attempt to overcome the previous high, indicates a reversal of the downward trend.
By analogy with an uptrend, if the market closes above the previous low, but cannot overcome the previous high, the market enters the trading range, and the downtrend is replaced by a flat.
Japanese candlestick chart
A regular line chart for a certain timeframe will contain information only about the closing price. To display a larger amount of data, another type of graphical interpretation of data is used – Japanese candlestick charts. This type is the most informative.
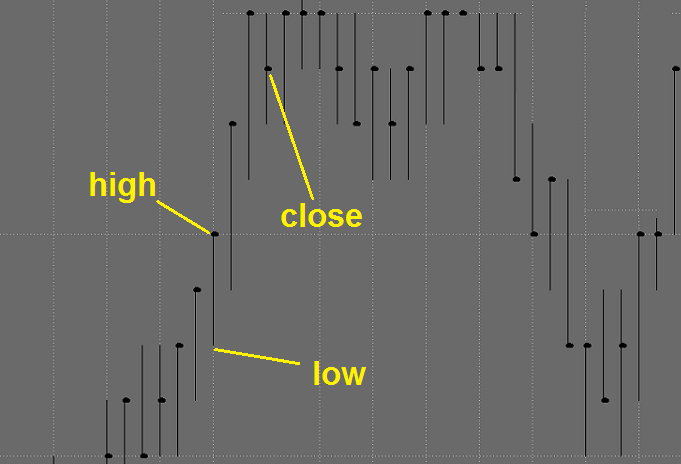
A Japanese candlestick represents a change in the price of an asset over a certain time period. It contains information about the opening, closing, maximum and minimum prices.
The Japanese candlesticks look like this: the low and high are connected by a vertical line. A rectangle is built between the opening and closing prices. This rectangle will be colored in one of two colors, depending on whether the candle was growing (white, green) or falling (black, red).
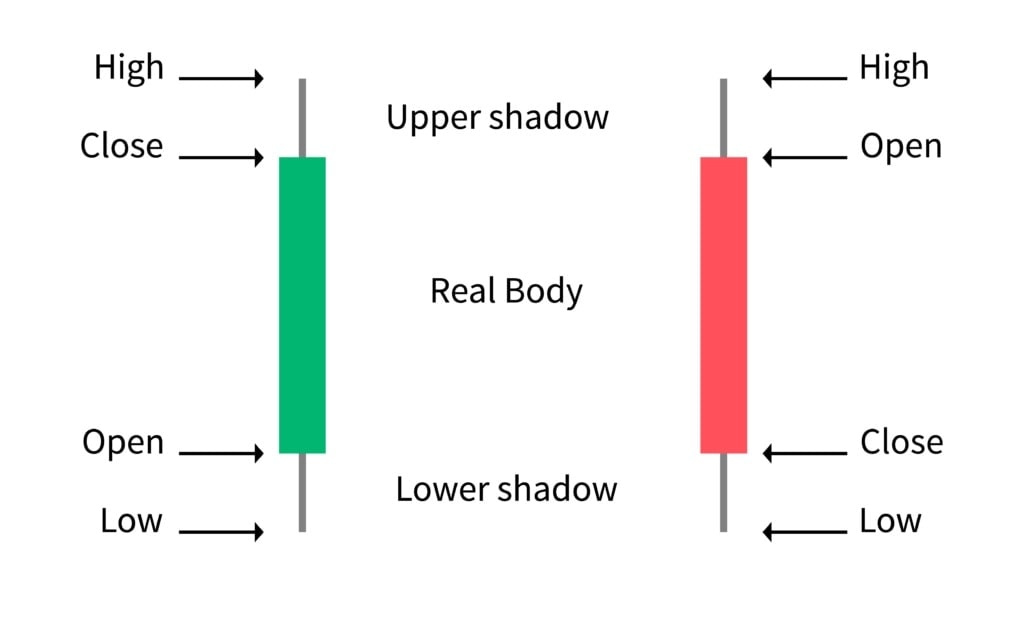
The candlestick consists of a body and shadows (tails). The body of the candlestick is a rectangle connecting the opening and closing prices. The shadow or tail is that vertical line between the body and the low or high.
There are three types of Japanese candlesticks:
- rising — if the opening price is lower than the closing price;
- falling — if the opening price is higher than the closing price;
- doji — if the opening and closing prices are the same or close.
What conclusions can be drawn from the shapes and sizes of candlesticks
By the size of the candlestick body, you can draw conclusions about how strong sellers and buyers are. The height of a growing candlestick indicates the number of buyers in the market. That is, the higher it is, the more buyers there are. And vice versa. The lower the falling candlestick, the more those who sell.
The shadows of candlestick can be a signal of loss of strength in the market of sellers or buyers. Let’s consider the following example: there was a growth of a candlestick. However, by the time of the closing of the market, it had fallen and left a large shadow on top. That is, the market was immediately controlled by buyers, but by the close there were more sellers and the price fell.
Thus, Japanese candlesticks help to display the price movement on the chart. However, using only this tool when analyzing the market is unwise, since candlesticks can give false signals. Therefore, traders most often use different types of technical and fundamental analysis tools together. An example of the use of technical analysis and the introduction of artificial intelligence based on it is MonInvAI, which predicts the values of stocks and cryptocurrencies for the future period.